Grading Note
Grading Note
We’ve calculated midpoint grades based on pset01, pset02, and the midterm according to the following formula:
\[\frac{\frac{1}{4} \frac{1}{9} ( \text{PSET01} + \text{PSET02} ) + \frac{3}{10}\text{MIDTERM}}{\frac{1}{4} \frac{2}{9} + \frac{3}{10}}\]Here is the distribution of those midpoint grades for all undergraduates in the class:
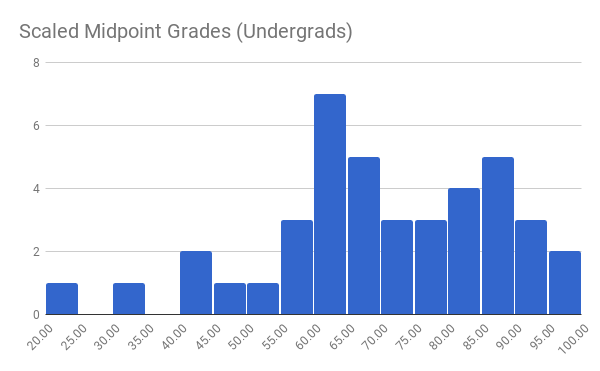
This distribution has the following statistics:
60	1st quartile
69	2nd quartile
82	3rd quartile
69	mean
17	stdev
If we were to roughly assign grades, right now, these would be the following ranges:
A	>85
B	65-85
C	51-65
D	41-50
F	<41
This should serve as a rough guide to how you’re doing so far. We can’t guarantee any particular distribution of final grades: the final median could be higher or lower than B, and the percent score required for a given letter grade might increase or decrease depending on how the class performs on the remainder of the assignments and the final.